# Audit Log
JFrog Connect provides an audit trail, also called the *Audit Log*, that includes records of user and device events throughout the system. In the audit log viewer, you can filter and view operations per specific actors, events, and resources. The audit log has a flexible filter that enables you to track and pin-point events for purposes of troubleshooting, security, testing, and auditing.
The audit log is available to customers who have [Jfrog Artifactory](https://jfrog.com/artifactory/) and to Administrator users only.
## View the Audit Log
To view the audit log, go to General Settings in the left navigation pane and click the Audit Log tab. The audit log appears as a list of events in chronological order and includes records from all fleets in the account.
Each row in the table represents an event in the system and provides information about the event such as:
* **Event Time**: The server timestamp when the action is initiated. This is a date and time according to Coordinated Universal Time (UTC).
* **Actor Type**: The kind of entity initiating the action. Can be a device, a user, or an API call.
* **Actor**: Shows either the email address or the name and UUID of the entity initiating the action.
* **Actor IP**: The IP address of the entity taking the action.
* **Event**: The operation that the actor did, for example, Create or Delete.
* **Resource Type**: The kind of entity acted upon, for example, an update flow or a pairing token.
* **Resource**: The specific entity that was acted on, identified by its name, a UUID, or both.
* **Fleet**: The name of the fleet and fleet key in the account where the event took place. For some events, Not Applicable appears. For example, an event that updates billing information applies to the whole account, and is not related to a specific fleet.
## Filter Audit Log Events
The default view of the audit log shows events from the last 30 days. You can filter the log to show only a specific subset of events.
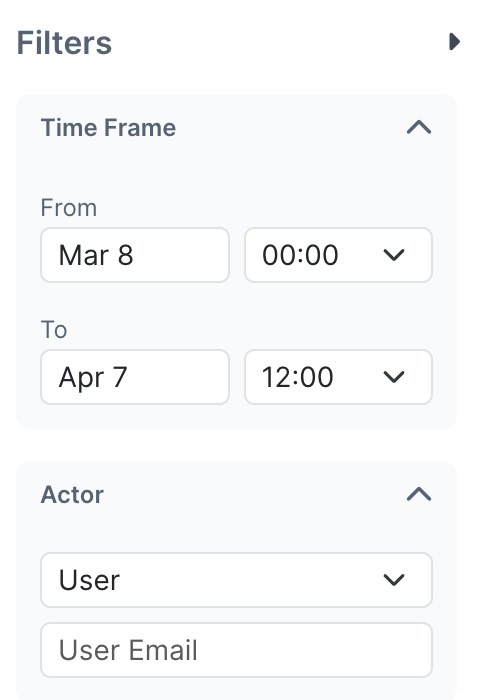
To filter the events in view, click the **Filter** icon on the upper right. The Filters panel appears on the right.
You can filter for a specific time frame by entering the starting and ending dates and times. When you click on either of the date boxes, a date picker box will open for you to choose the date. Click the down arrows to choose the starting and ending times.
### Filter by Actor
You can filter by Actor or Resource, but not both. To choose the type of actor, for example, User, enter the email address of a specific user. The relevant events will appear automatically.
### Filter by Resource
1. If you filter by resource, choose the resource Type, for example, the Fleet.
2. Choose to filter by Value or Event.
* If you filter by Value, enter the UUID of the specific resource.
* If you filter by Event, enter the event, for example, Start.
### Clear the Audit Log Filter
To clear the Audit Log filter, click **Clear All** at the top right.
If you have partially defined a filter, set it back to **All** manually to clear it. For example, you have set the Resource filter to Fleet and have not yet entered a value, but now you decided to use the Actor filter instead of the Resource filter. Set the Resource filter back to **All**, then define the Actor filter.
## What’s Next?
Learn how to [export the audit log](https://docs.connect.jfrog.io/administration-new-ui/general-settings/audit-log/export-audit-log) to a file.


