# Artifacts on Device
The Artifacts feature (available in Enterprise accounts only) gives you visibility into artifacts downloaded to your devices from JFrog Artifactory and the JFrog Connect deployments that put them there. This artifact inventory helps you maintain better control over what's running on your device and the history of what software has been downloaded to the device.
The Artifacts tab provides detailed information about:
* **Artifact status and activity**: A list of artifacts deployed on the device and information about the running status of those artifacts. (The artifacts listed are only those that are in the same place they were deployed to on the device.)
* **Deployment traceability**: You can trace each artifact back to its originating deployment, including the deployment's success or failure status. This connection between deployments and their resulting artifacts makes troubleshooting and auditing much more straightforward.
* **Processes running**: You can see the containers and processes that were created from each artifact, along with their current state.
* **Risk assessment**: An overall risk level calculated for each device based on the JFrog XRay security analysis, helping you prioritize your attention. In addition, for each artifact you can see a summary of vulnerabilities by severity and a breakdown of risks detected.
This visibility helps you maintain better accountability and traceability across your device fleet while enabling more informed risk management decisions.
### Feature Requirements
* JFrog customers who have Connect Enterprise or Connect Enterprise Trial can use this feature. In order to upgrade your license, contact your[ JFrog account manager](https://jfrog.com/contact-us/).
* Connect Agent 8.0 or higher is required for information to appear in the Artifacts column of the Devices table, and in the Artifacts tab.
## View Artifacts and Detailed Information
To view a listing of artifacts on your device and detailed information about the artifacts, do the following:
1. In Connect, go to **Devices** and click the row of your device.
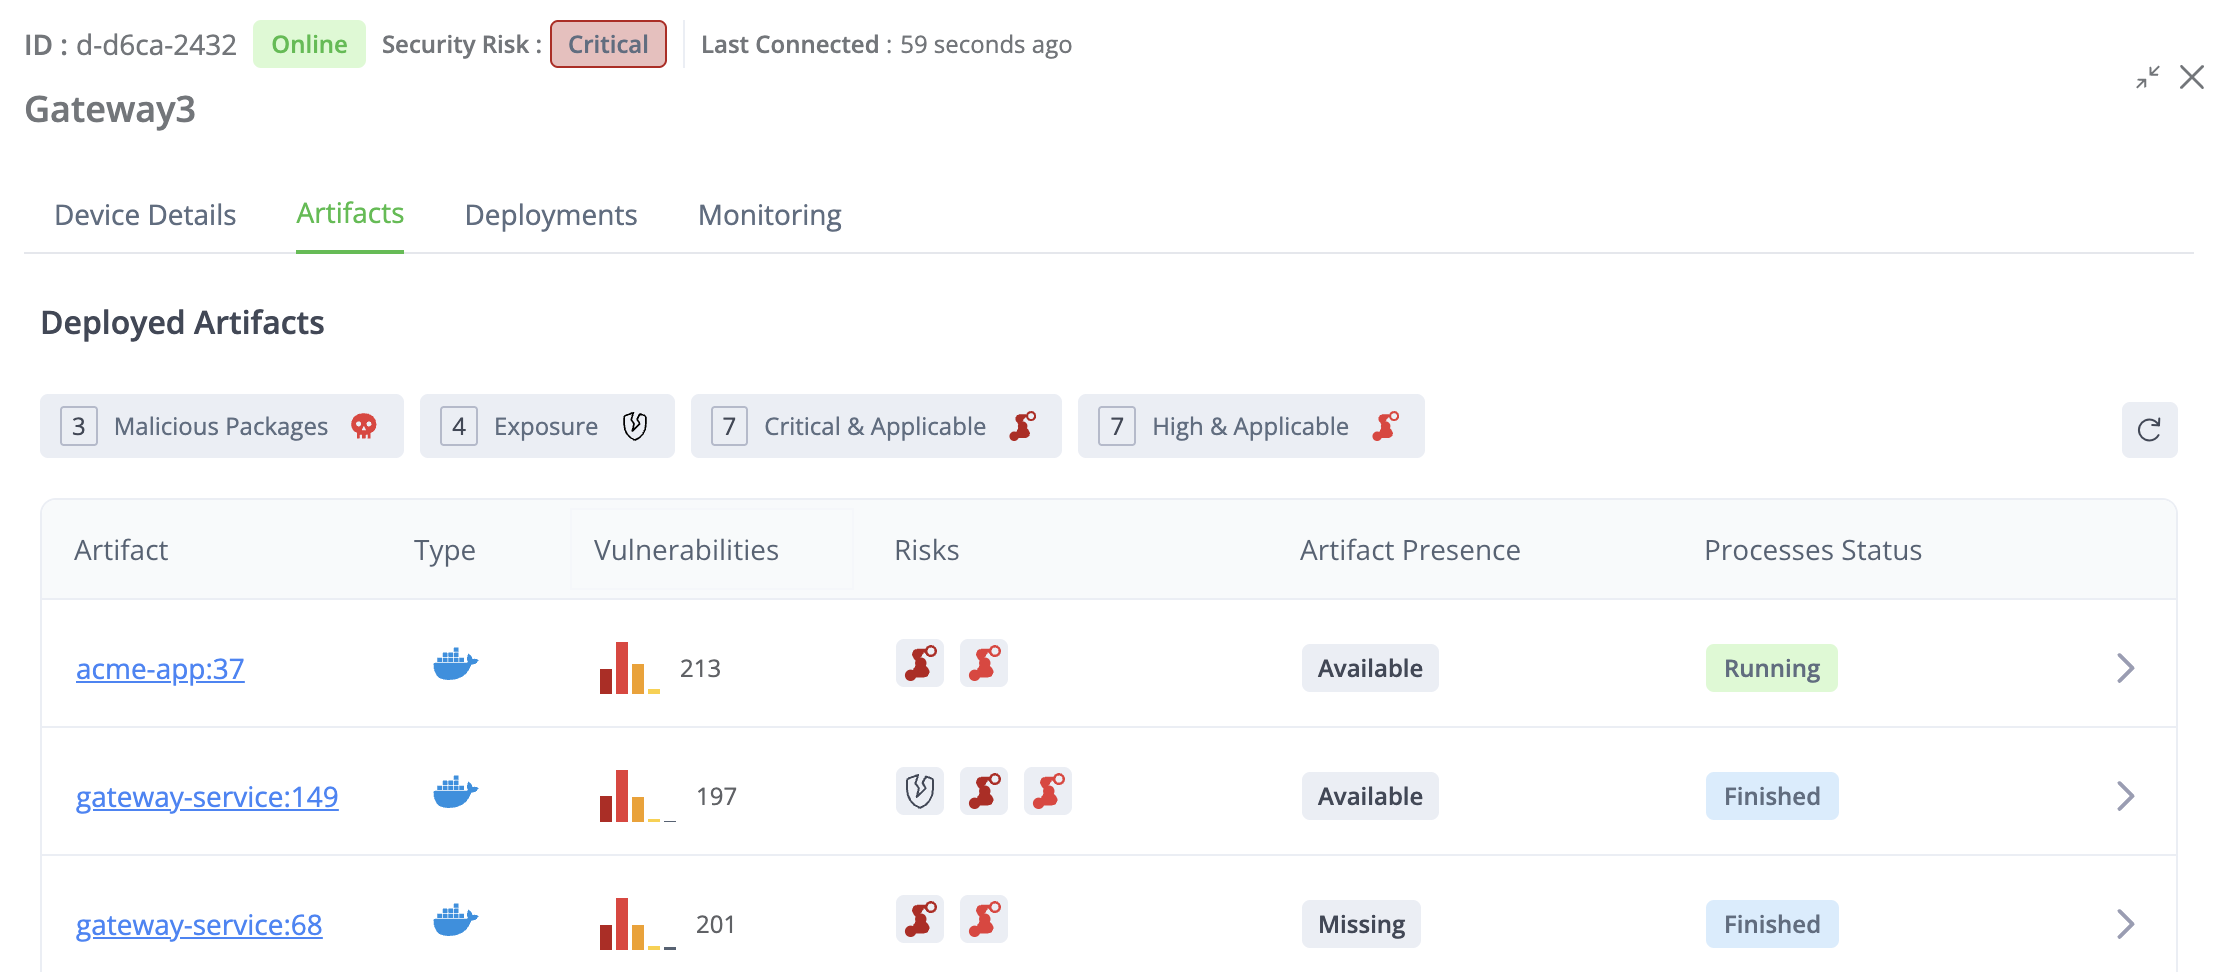
2. In the Device Details panel, choose the **Artifacts** tab. In the Deployed Artifacts table, each row shows information about an artifact and version on the device (see below for description).
3. To see Process and Deployment Information about each artifact, click the arrow (**>**) on the right in the artifact row.
The Deployed Artifacts Table, the Process Information, and the Deployment Information tables are described below.
## Deployed Artifacts Table
The Deployed Artifacts table lists each artifact that was downloaded from Artifactory to the device and provides security and status information about the artifacts. There is one row for each Artifact+Version downloaded.
You can click the expander arrow in the upper right corner to enlarge the table. The table has the following columns:
* **Artifact**: The name and version of the artifact and a hyperlink to the folder where it is kept in Artifactory.
* **Type**: An icon showing what kind of artifact it is, for example, Docker or Debian.
* **Vulnerabilities**: The CVEs as detected in the [JFrog Xray](https://jfrog.com/xray/) scan. Can be critical, high, medium, low, or unknown, and a tooltip shows the number of each level. This is also a hyperlink to the XRay page where you can see more details about the security analysis. If the artifact did not have an XRay scan, the Vulnerabilities cell is blank.
* **Risks**: The artifact might show one or more icons indicating the following risk indications:
* **Malicious Packages**: One or more [malicious packages](https://jfrog.com/help/r/jfrog-security-user-guide/products/xray/features-and-capabilities/sca/security/malicious-package-detection) detected.
* **Exposure**: One or more [exposures](https://jfrog.com/help/r/jfrog-security-user-guide/products/advanced-security/features-and-capabilities/advanced-security-reports) detected.
* **Critical and Applicable**: There are one or more malicious packages or exposures detected that [can be exploited in the context](https://jfrog.com/help/r/jfrog-security-user-guide/products/advanced-security/features-and-capabilities/contextual-analysis-of-cves) of the scanned artifact, and the potential impact is Critical in severity.
* **High and Applicable**: There are one or more malicious packages or exposures detected that can be exploited in the context of the scanned artifact, and the potential impact is High in severity.
* **Artifact Presence**: Whether an artifact is in the location it was downloaded to on the device. Can be indicated as:
* **Available**: In the same location it was downloaded to.
* **Missing**. Was either deleted or moved to another location on the device.
* **Process Status**: Can show the statuses listed below. Relevant only to Docker images.
* **Running**: If one of the artifact's processes is running.
* **Finished**: If all of the artifact's processes are not running.
* **Not Executed**: If the artifact was downloaded, but has not started to run.
* **N/A**: There is no information about the process. Appears for artifacts that are not Docker images.
* **Deployed Artifacts Details**: Click the arrow (**>**) in the row to see the Process and Deployment information.
### Quick Filters
The buttons above the table enable you to easily filter the artifacts according to different risk parameters. Each button indicates the risk parameter and the number of artifacts matching that parameter.
* Malicious Packages
* Exposure
* Critical & Applicable
* High & Applicable
### Process Information
This tab shows detailed information about the container or process associated with this artifact.
* **Container ID**: Name of the Docker container. This is only for Docker images. Otherwise, this column will be called PID for Process ID.
* **Status**: The container or process is either Running, Finished, or Not Executed.
* **Start Time**: When the container or process started.
* **End Time**: When the container or process finished.
* **Command**: Command that was used with the deployment to start the container or process.
* **Parameters**: Values of parameters used in the command. For Docker, this will be blank.
### Deployment Information
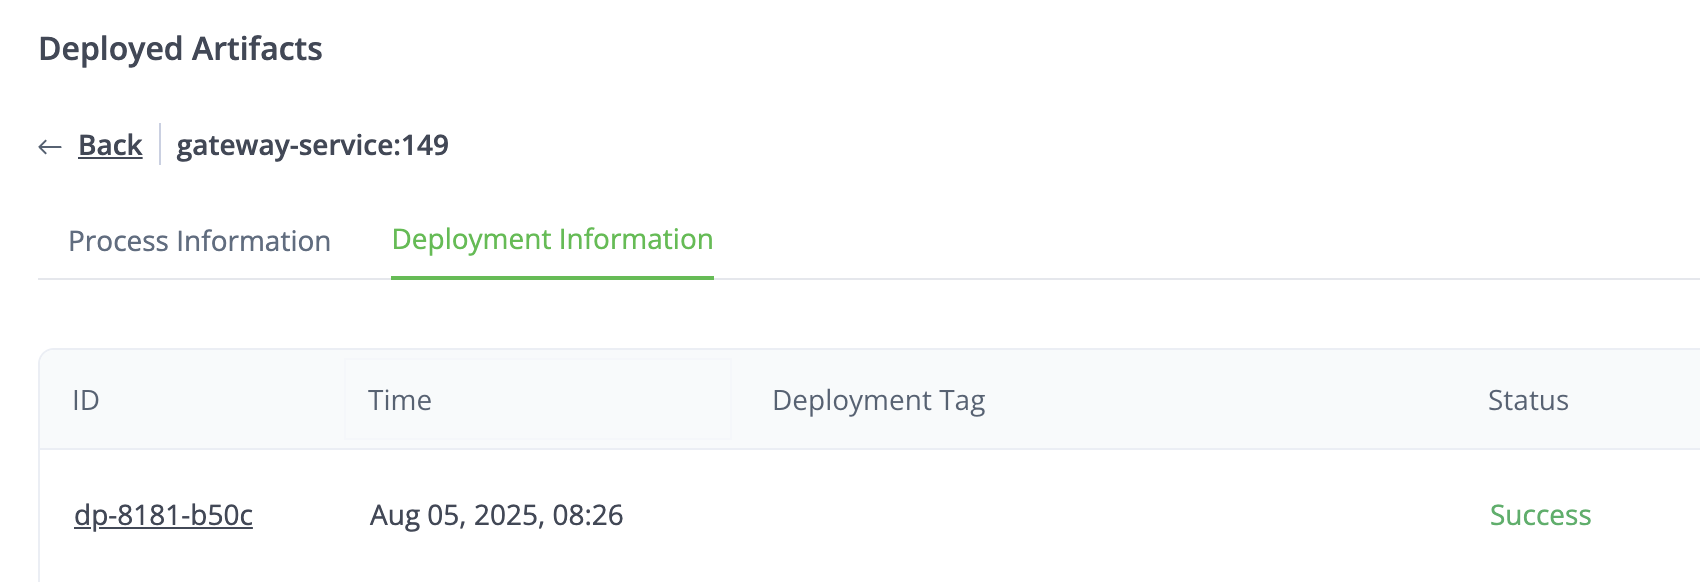
This tab provides important information about the deployments that downloaded the artifacts. The table includes the following:
* **ID**: The UUID of the deployment associated with the artifact. This is also a hyperlink to the Deployment in Connect.
* **Time**: The deployment date and time.
* **Deployment Tag**: A name and version associated with the deployment. This is optional and might not have a Deployment Tag.
* **Status**: The status of the deployment.
## What's Next?
Learn how to [block updates](https://docs.connect.jfrog.io/features-new-ui/devices/view-device-details/block-updates-with-update-trigger) to a device.


