# View Deployment Progress
Once you have [launched a deployment](https://docs.connect.jfrog.io/features-new-ui/deployments/update-deployment) in JFrog Connect, you have full visibility into the status of the software update. This includes a brief summary of all deployments in the Runs table and a detailed view for each deployment.
To view the progress of your most recent deployments:
* Go to **Deployments** in the left menu and the **Runs** tab. The Runs table shows you the progress summary of your software deployments.
The Runs table shows the following information:
* **Deployment ID**: Unique identifier of the deployment and phase. For a [phased deployment](https://docs.connect.jfrog.io/features-new-ui/deployments/update-deployment/set-phased-rollout), a one-digit suffix indicates the phase. Values 1-3 indicate the download phases, and 4 indicates a rollback phase.
* **Deployment Tag**: The deployment tag name, if one was configured, and the deployment tag version.
* **Start Time (GMT)**: The date and time when the deployment started.
* **Type**: Indicates that this is a Regular or a Phased Rollout.
* **Flow Name**: The name of the update flow used for the deployment.
* **Vulnerabilities**: A brief listing of the vulnerability statuses detected according to the latest [vulnerability scan](https://docs.connect.jfrog.io/features-new-ui/deployments/update-flow/vulnerability-scans). Hover your cursor over the CVE Severity to see the tally of the CVE Severities of vulnerabilities detected. Click the CVE Severity to find out more information about the CVEs.
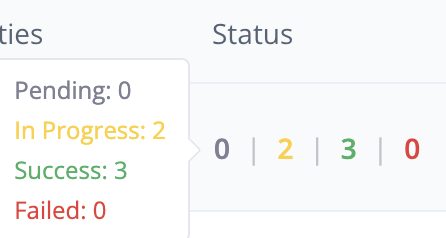
* **Status**: The number of devices in each deployment status. Hover over the numbers to see the popover with the status names. Click on the numbers to see the [Detailed Deployment Information](https://docs.connect.jfrog.io/features-new-ui/deployments/update-deployment/view-deployment-progress/detailed-deployment-information).
### Refresh
To refresh the data manually, click the refresh button on the upper right.
### Filter
If you do not see the deployments you are looking for, click the filter button on the upper right and use the filter to change the deployments in view.
## What’s Next?
Learn more about viewing the [Detailed Deployment Information](https://docs.connect.jfrog.io/features-new-ui/deployments/update-deployment/view-deployment-progress/detailed-deployment-information).


